HiGraph: A Large-Scale Hierarchical Graph Dataset for Malware Analysis
Abstract
The advancement of graph-based malware analysis is critically limited by the absence of large-scale datasets that capture the inherent hierarchical structure of software. Existing methods often oversimplify programs into single-level graphs, failing to model the crucial semantic relationship between high-level functional interactions and low-level instruction logic. To bridge this gap, we introduce HiGraph, the largest public hierarchical graph dataset for malware analysis, comprising over 200M Control Flow Graphs (CFGs) nested within 499K Function Call Graphs (FCGs). This two-level representation preserves structural semantics essential for building robust detectors resilient to code obfuscation and malware evolution. We demonstrate HiGraph's utility through a large-scale analysis that reveals distinct structural properties of benign and malicious software, establishing it as a foundational benchmark for the community. The dataset and an interactive explorer are publicly available at higraph.org.
Dataset Construction
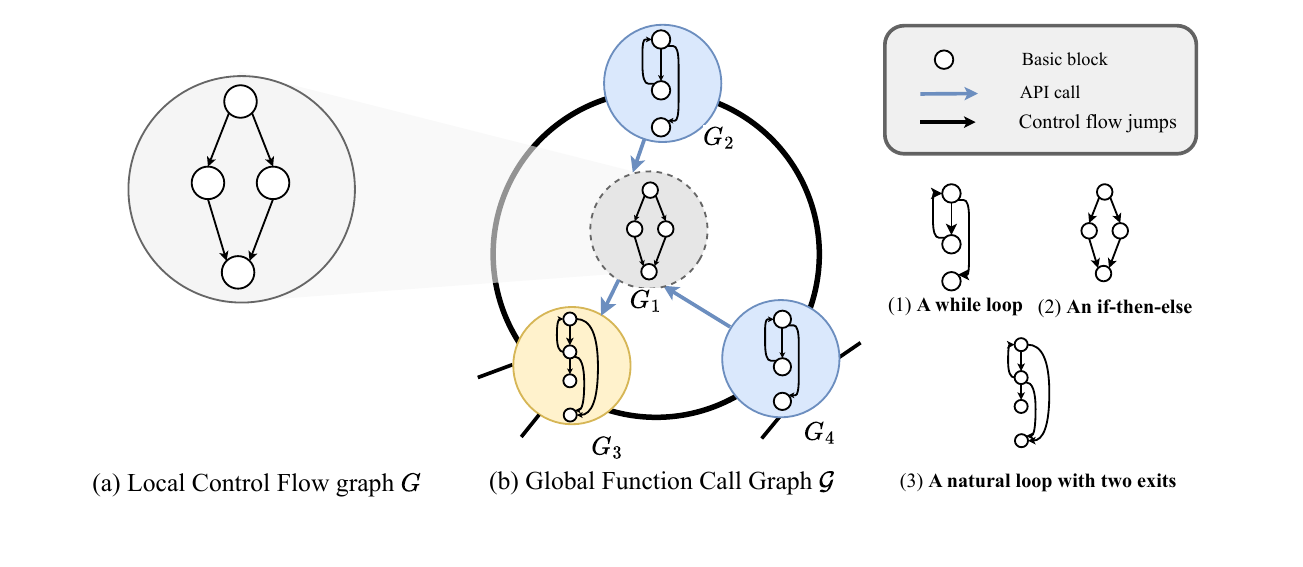
Overview of HiGraph: (a) end-to-end construction pipeline; (b) the resulting two-level hierarchy with one FCG per app and one CFG per function.
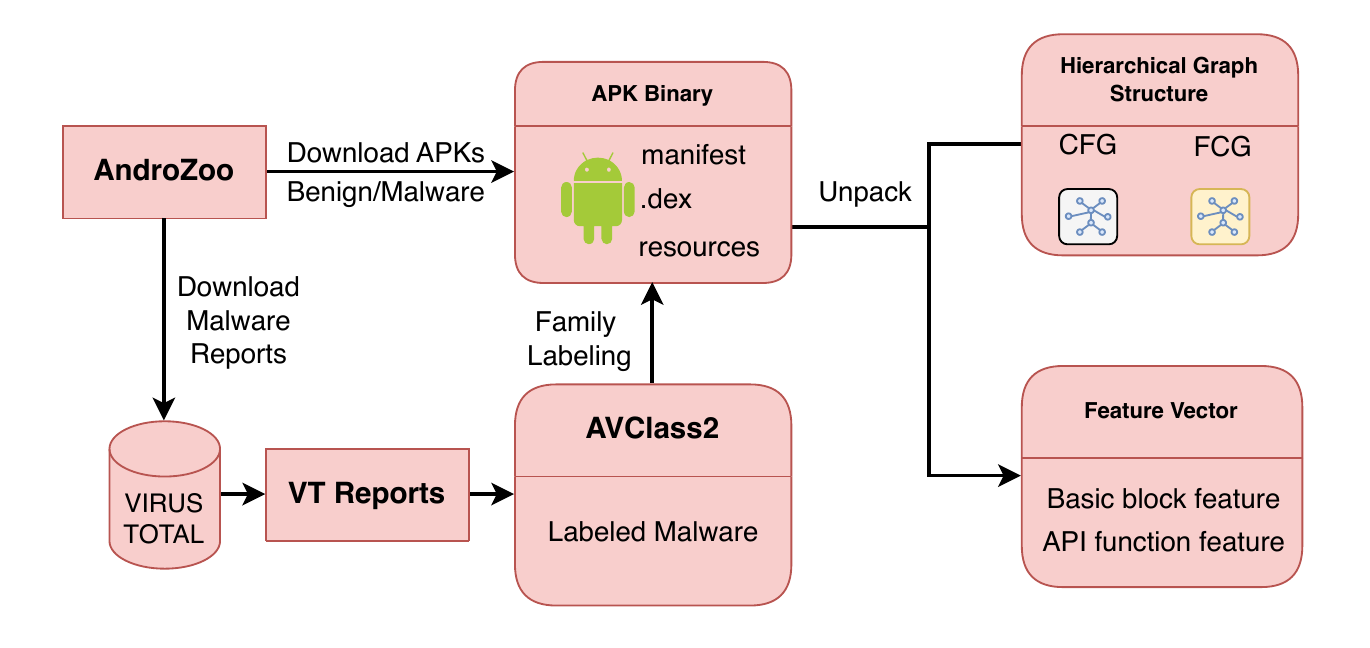
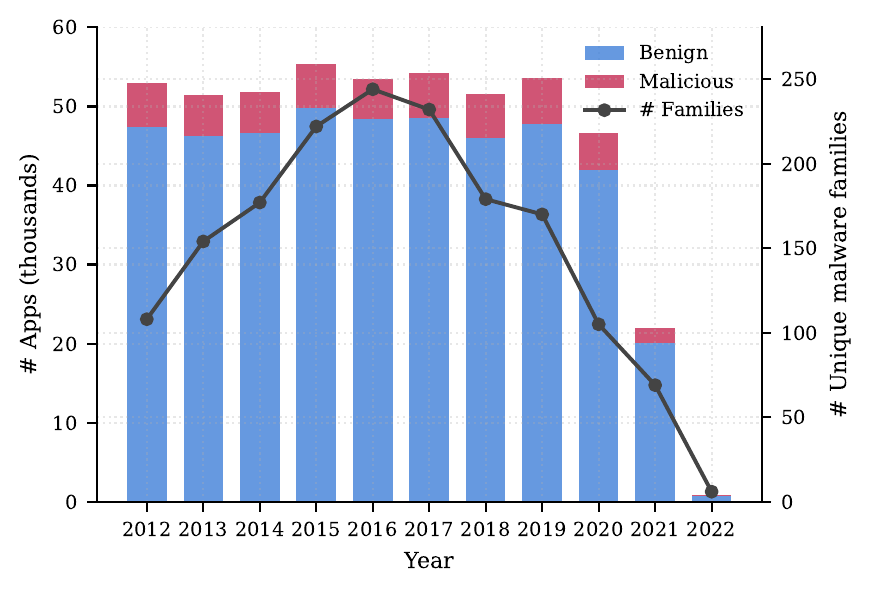
- Curation. We collected 499,981 Android applications from
AndroZoospanning January 2012 – December 2022, prioritising two properties: temporal consistency (even distribution across years to mitigate concept drift) and spatial consistency (a realistic ≈ 1:9 malware-to-benign ratio mirroring real-world incidence). - Label assignment. Ground truth is established from
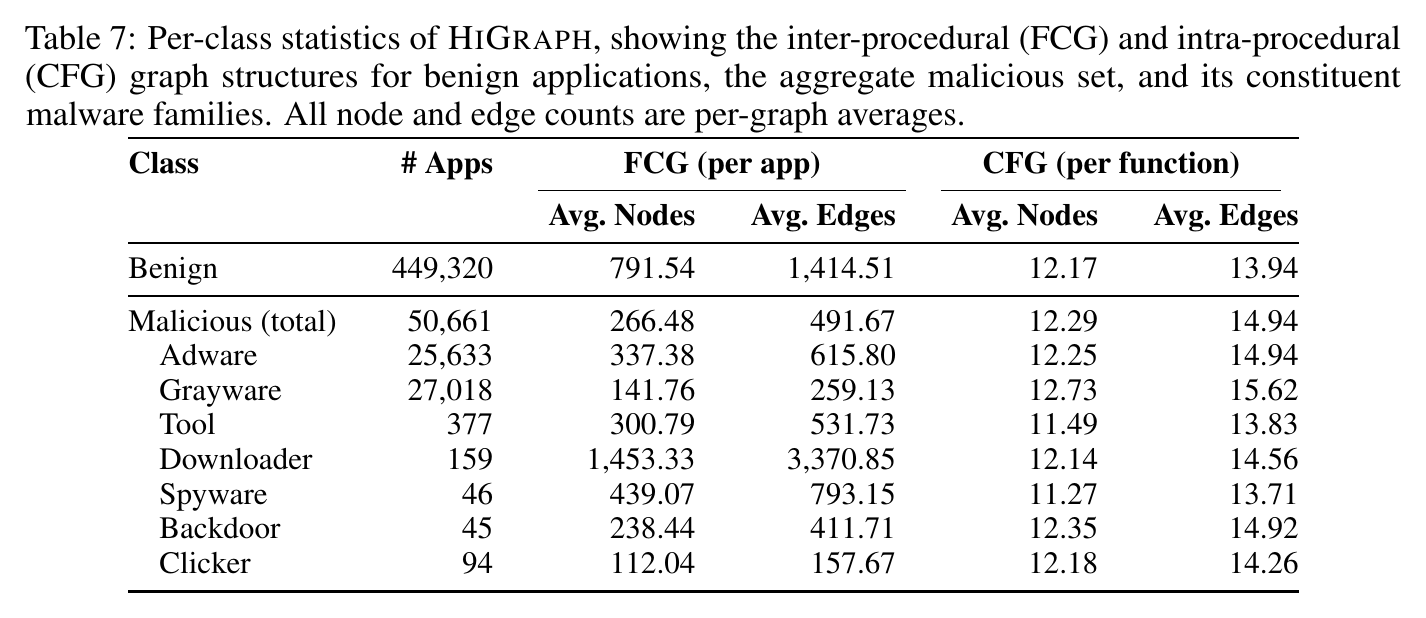
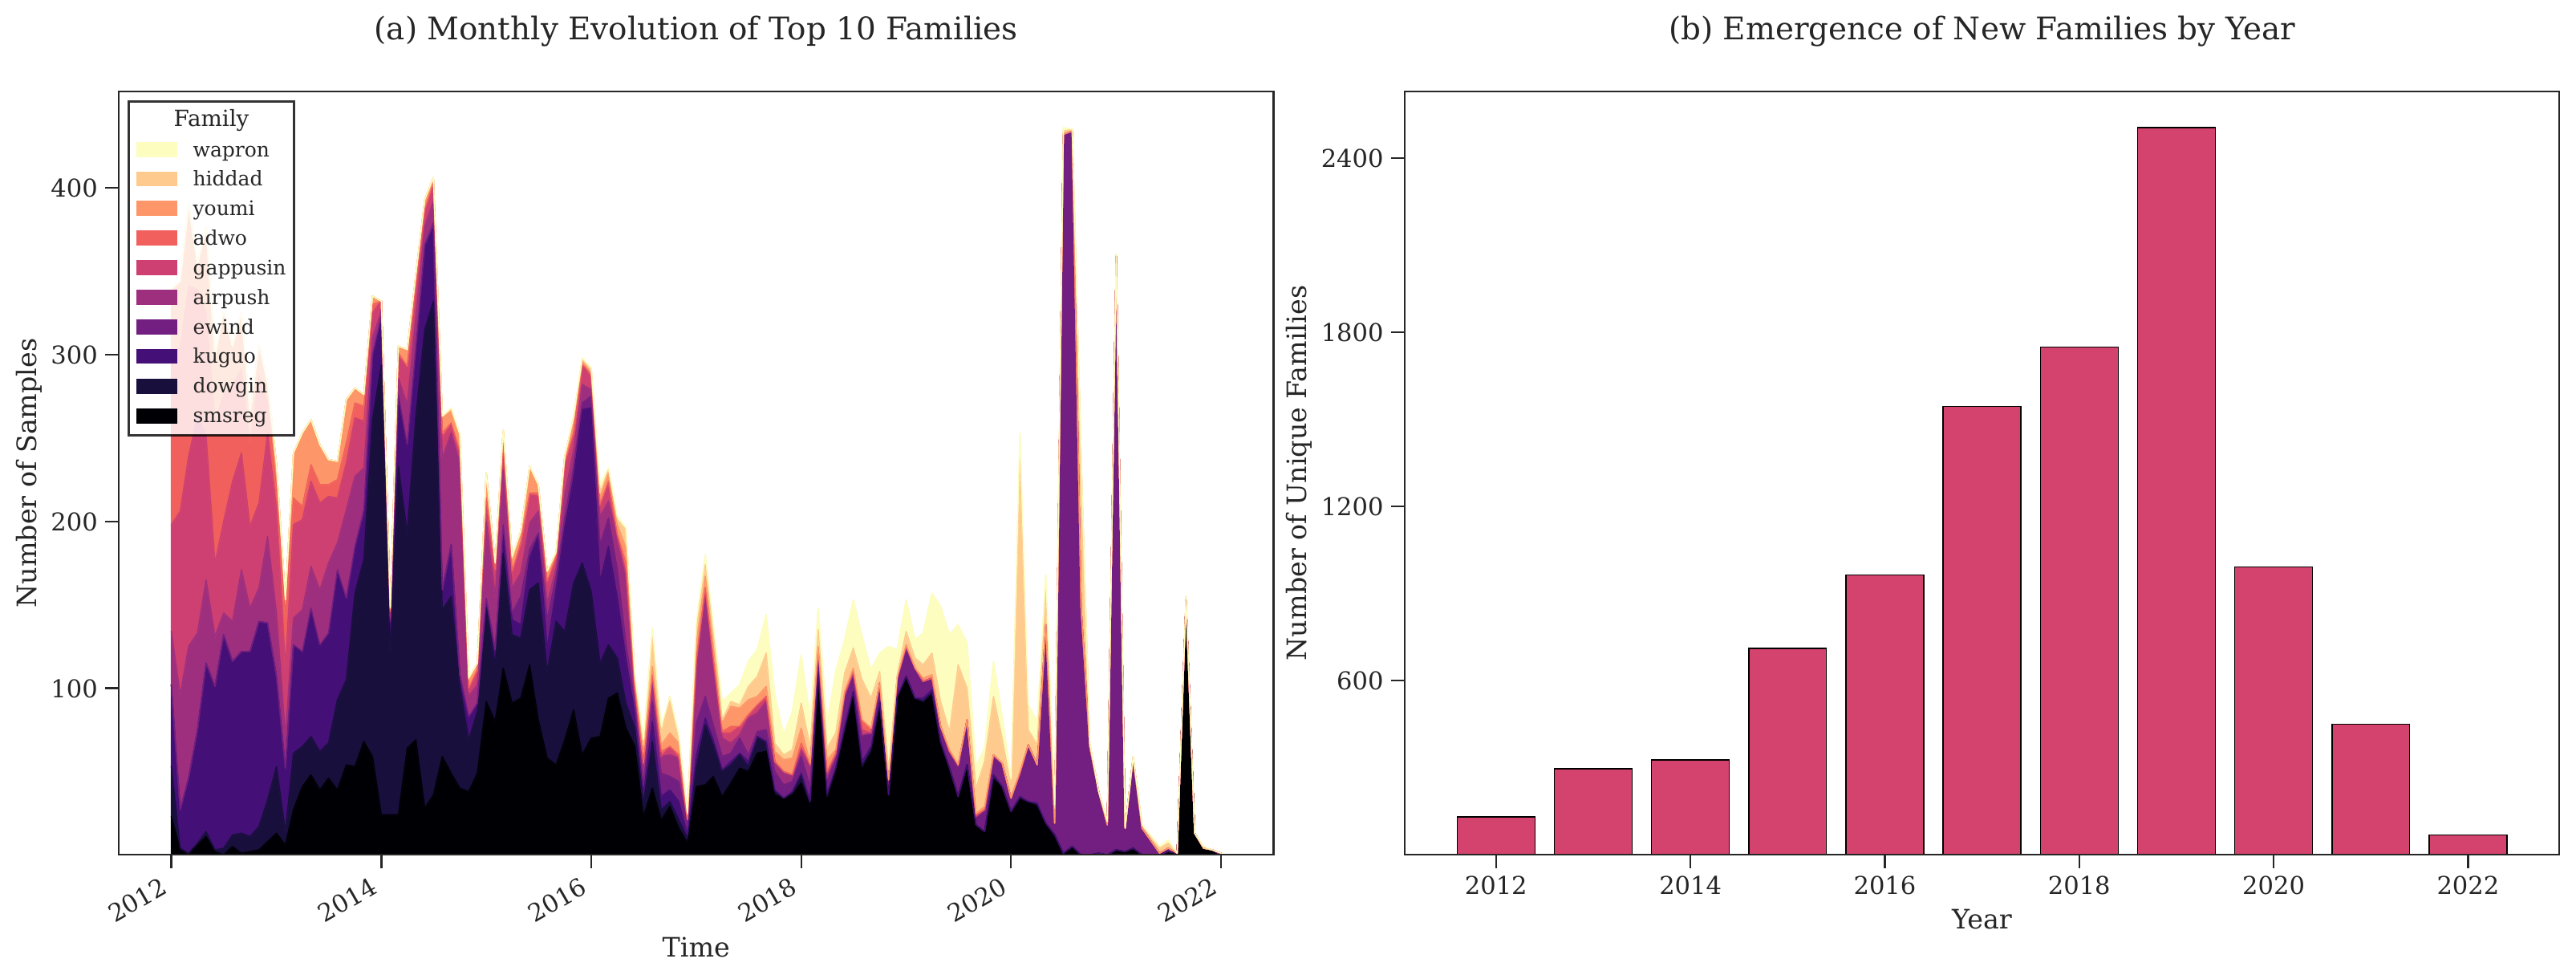
VirusTotalreports obtained via the academic API. An application is labelled malicious if detected by ≥ 15 antivirus engines — a conservative threshold widely adopted in the literature. Benign samples have zero detections. The procedure yields 50,661 malicious and 449,320 benign applications. - Family labelling. Fine-grained family labels are assigned with
AVClass2, yielding 683 distinct malware families across the 10-year window for downstream classification and drift studies. - Hierarchical graph extraction. Each APK is decompiled with
Androguardinto one global Function Call Graph (FCG) per app and one local Control Flow Graph (CFG) per function — yielding 201,792,085 CFGs nested within 499,981 FCGs. We retain the subgraph induced by local (developer-written) functions and apply high-sensitivity filters to keep only call edges that connect to security-relevant APIs. - Storage & format. The dataset ships as PyTorch Geometric
.ptshards keyed by app ID, accompanied bymetadata.jsonwith year / family / label per sample. A reference loader is provided in thehzcheney/HiGraphrepository. - Release & maintenance. HiGraph is released under
CC BY-NC-SA 4.0with the full preprocessing pipeline (decompilation, graph extraction, feature engineering) open-sourced alongside it.
Dataset Statistics
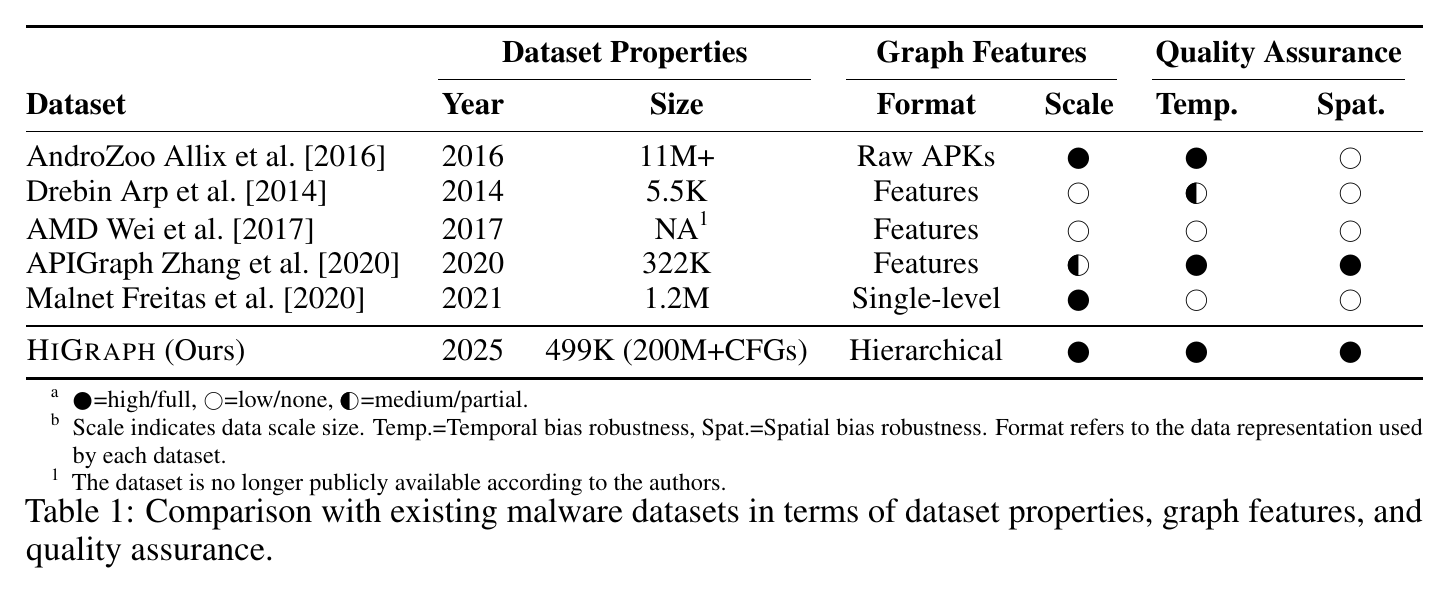
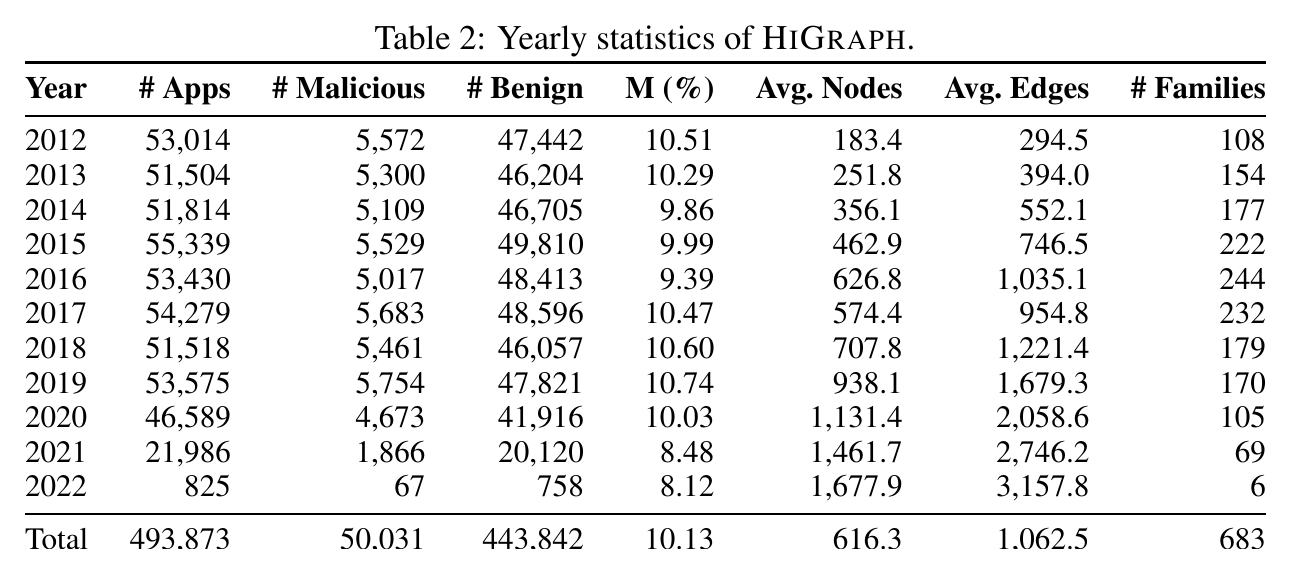
HiGraph is the first hierarchical graph dataset for cybersecurity at this scale. Below: per-year composition, per-class structural properties, and how HiGraph compares with existing malware corpora.
Loading the Dataset
HiGraph is hosted on Hugging Face Hub. The fastest path is the official CLI — no Hugging Face account required for public datasets.
# 1. Install the official CLI
pip install -U "huggingface_hub[cli]"

# 2. Download the full dataset to ./higraph
huggingface-cli download hzcheney/Hi-Graph \
    --repo-type dataset \
--local-dir ./higraphfrom huggingface_hub import snapshot_download
# Returns the local path to the downloaded dataset snapshot
path = snapshot_download(
repo_id="hzcheney/Hi-Graph",
repo_type="dataset",
local_dir="./higraph",
)After download you'll find .pt shards (PyTorch Geometric tensors) plus per-year metadata in ./higraph. See the GitHub repository for the loader, baseline training scripts, and the full benchmarking harness.
Interactive Dataset Explorer
We provide an in-browser explorer to inspect individual samples — visualise an application's FCG and drill down into any function's CFG, with per-graph metadata (year, family, structural metrics).
Launch Explorer →BibTeX
@article{chen2025higraph,
  title={HiGraph: A Large-Scale Hierarchical Graph Dataset for Malware Analysis},
  author={Chen, Han and Wang, Hanchen and Chen, Hongmei and Zhang, Ying and Qin, Lu and Zhang, Wenjie},
  journal={arXiv preprint arXiv:2509.02113},
  year={2025}
}